Dublin Rev. 2026.04 2026 / 04 / 24
Data, Physics & the cosmos.
Who
Jigar Patel. Analyst, Python developer, backyard astronomer. Based in Dublin.
What
Dashboards. Models. Open-source tooling. Astrophotography when the sky cooperates.
Python● Pandas● PostgreSQL● ECharts● scikit-learn● TensorFlow● PyTorch● QGIS● AWS● Docker● Python● Pandas● PostgreSQL● ECharts● scikit-learn● TensorFlow● PyTorch● QGIS● AWS● Docker●
§ 01
Profile, the short version.
Est. 2022 · Dublin, IE

I turn data into decisions, and occasionally into pictures of galaxies.
Trained as a physicist, retrained as a data analyst. I care about clarity, correctness, and speed to insight. My work spans interactive dashboards, statistical modelling, ML experiments, and an open-source library I maintain for chart-lovers.
M.Sc. Data Science B.Sc. Physics Dublin, IE
- 7Projects
- 16Tools
- 2Degrees
- ∞Curiosity
§ 02
Selected work.
6 projects / 2022–2026
# 4-line figure
import echartsy as ec
fig = ec.figure(height="480px")
fig.bar(df, x="Quarter", y="Revenue", gradient=True)
fig.show()
Physics · Algorithms
Barnes–Hut Orbits
N-body gravitation with a quadtree that scales beyond O(N²).
GitHub ↗
ML · Computer Vision
Aerial → Maps
CycleGAN that translates satellite photos into map-style renderings.
GitHub ↗
Reinforcement Learning
Lunar Lander RL
TensorFlow agent that learns to land on LunarLander-v2.
GitHub ↗
Currently in orbit.
- 01 Maintaining echartsy (v0.7.4) . Pandas-native fluent builder for Apache ECharts: 19 chart types, three render targets (Jupyter, Streamlit, browser). Latest release added six color palettes and five style presets.
- 02 Reading . Thinking in Systems (Meadows) and Gaia DR4 release notes.
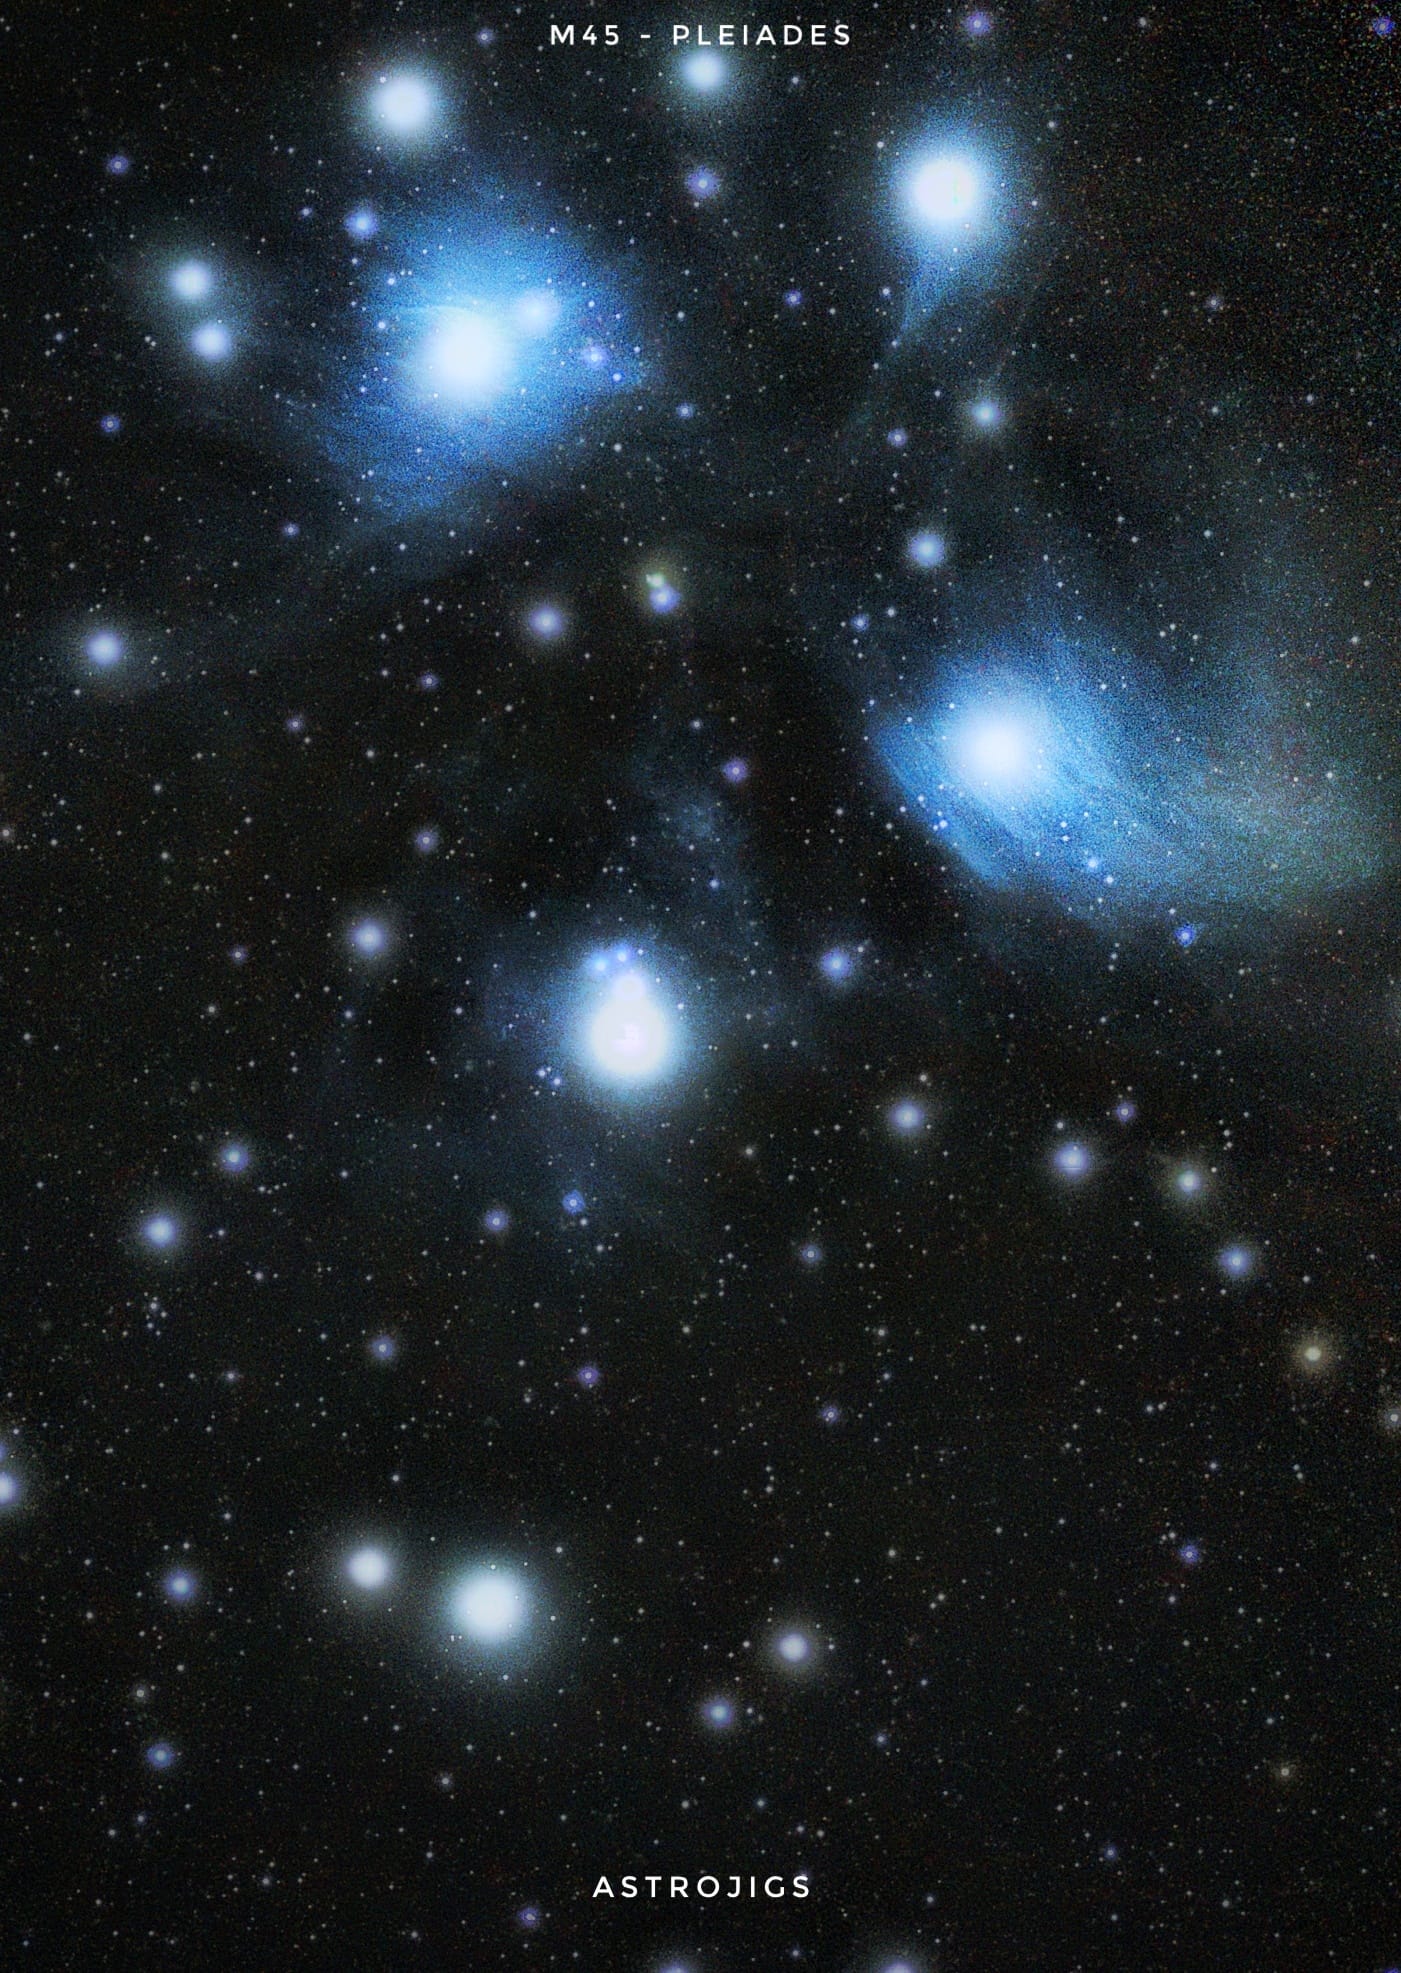
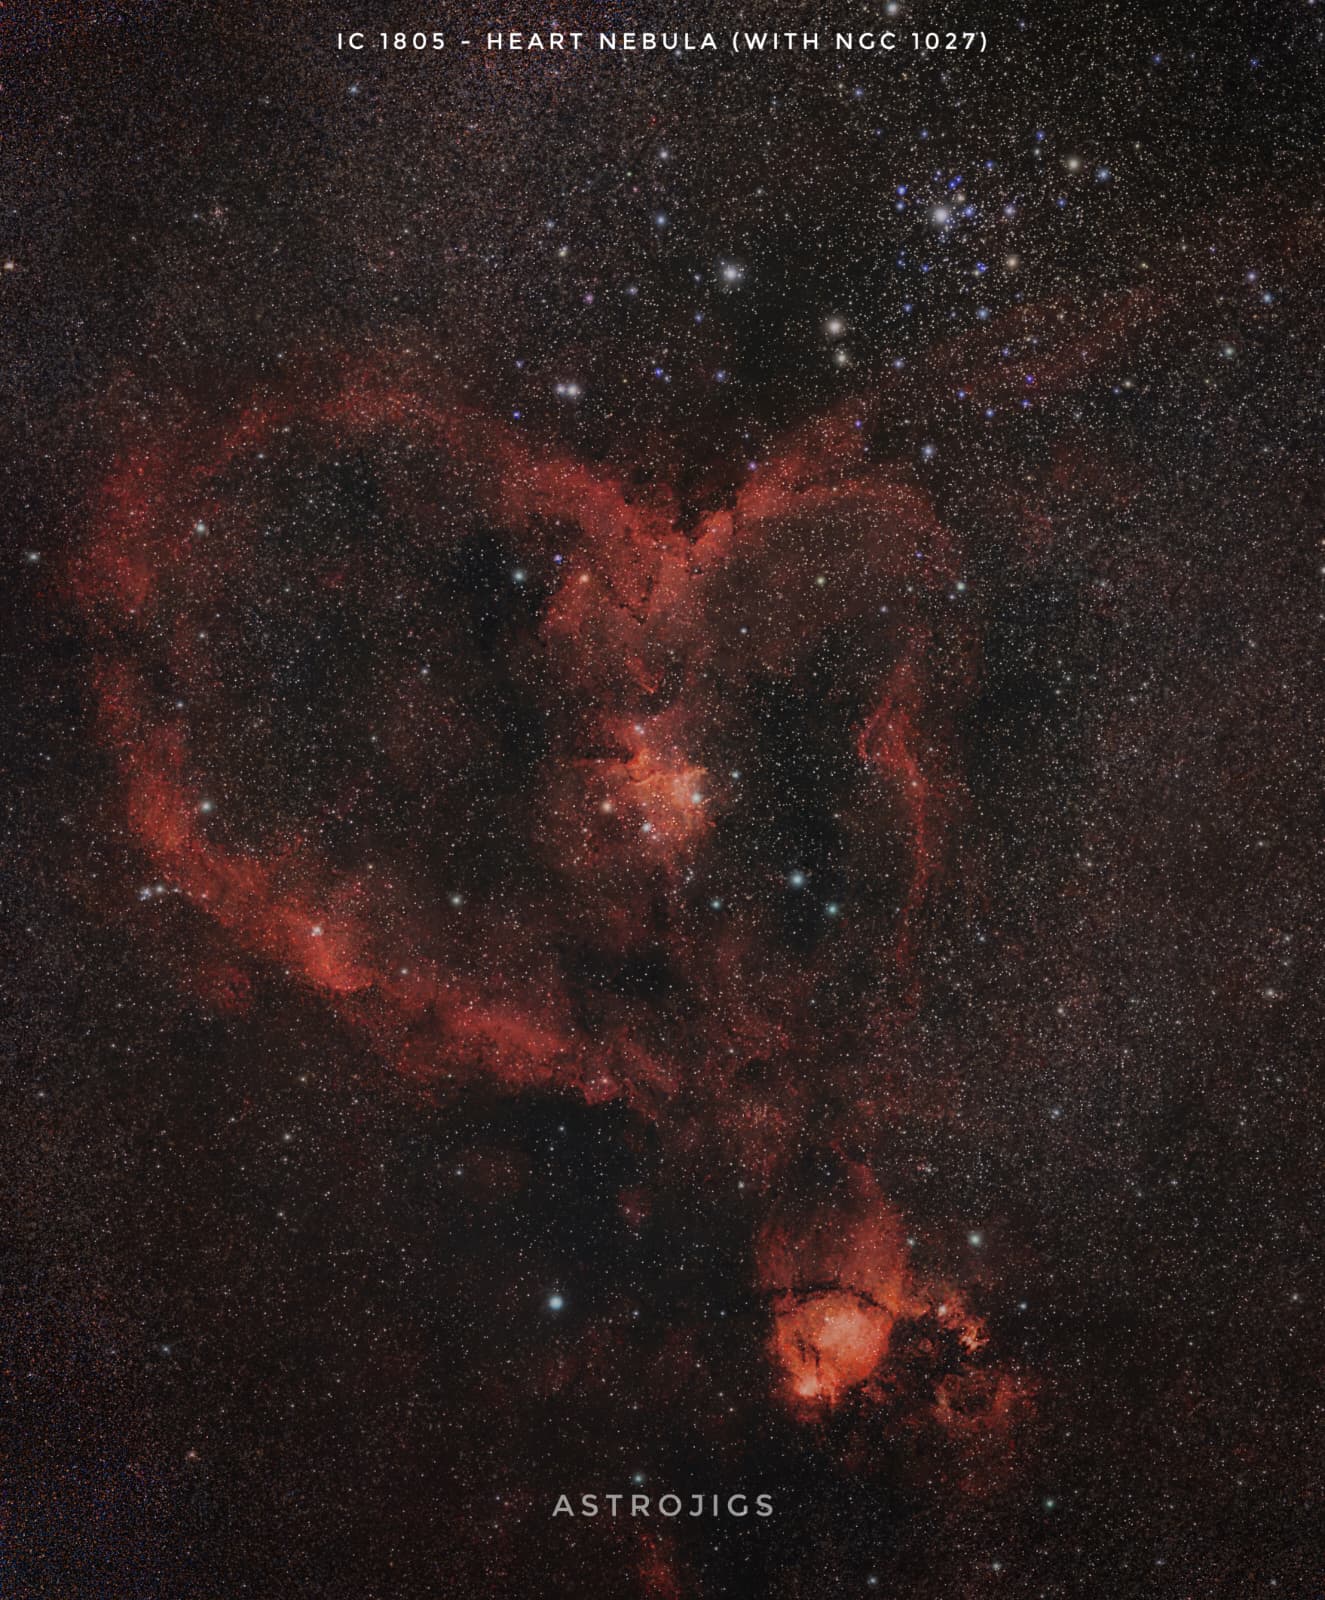
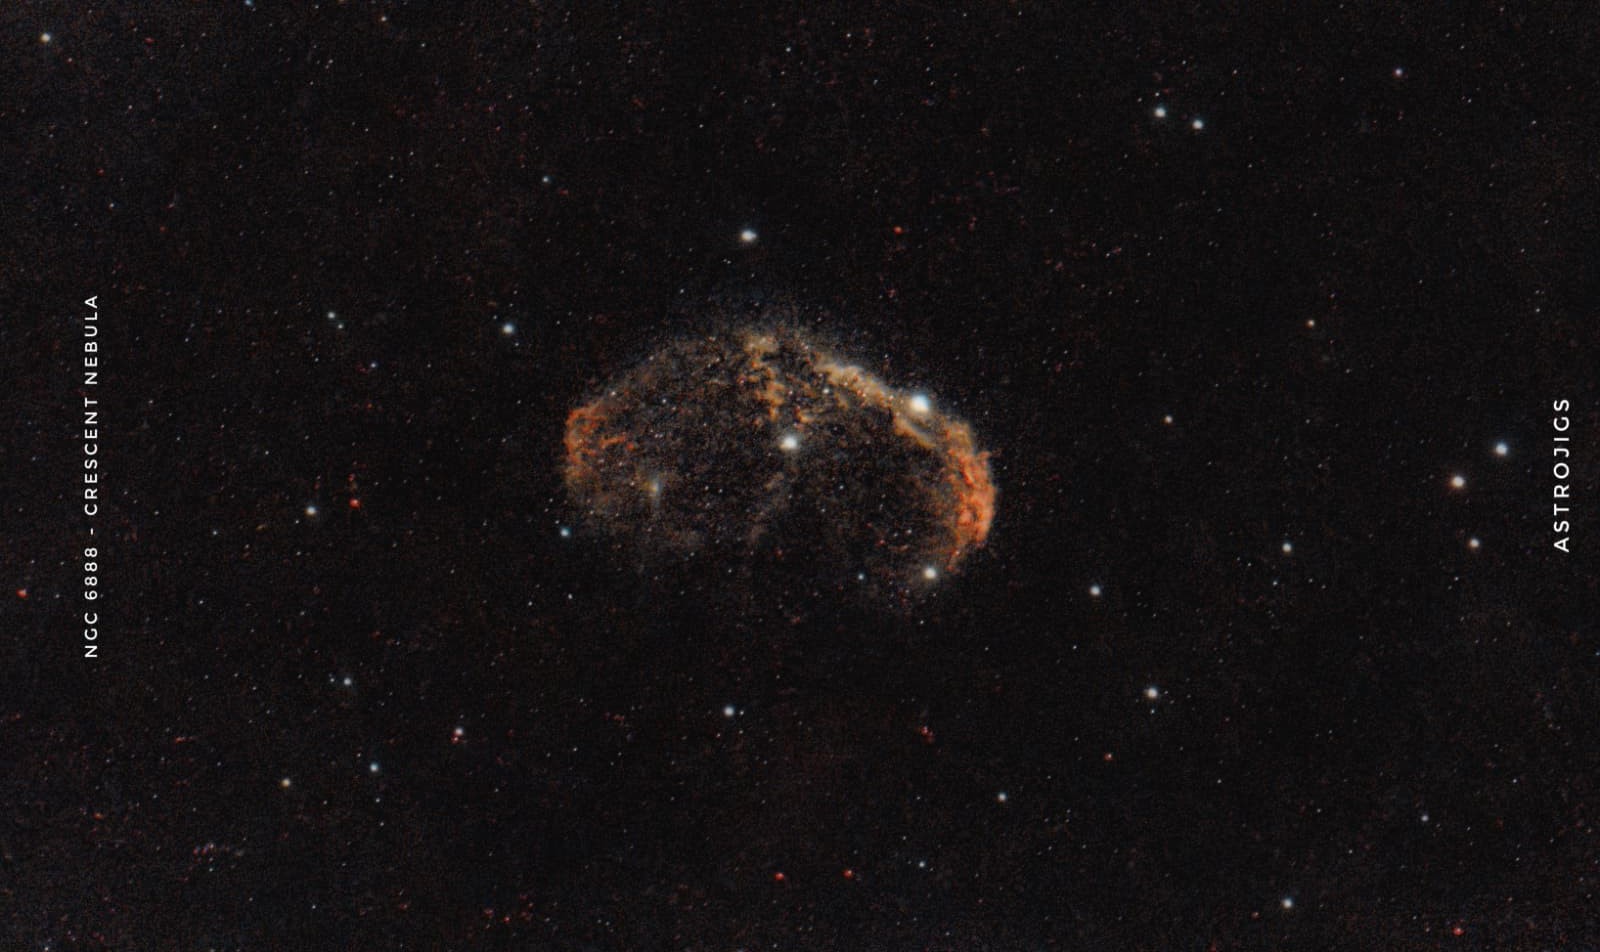
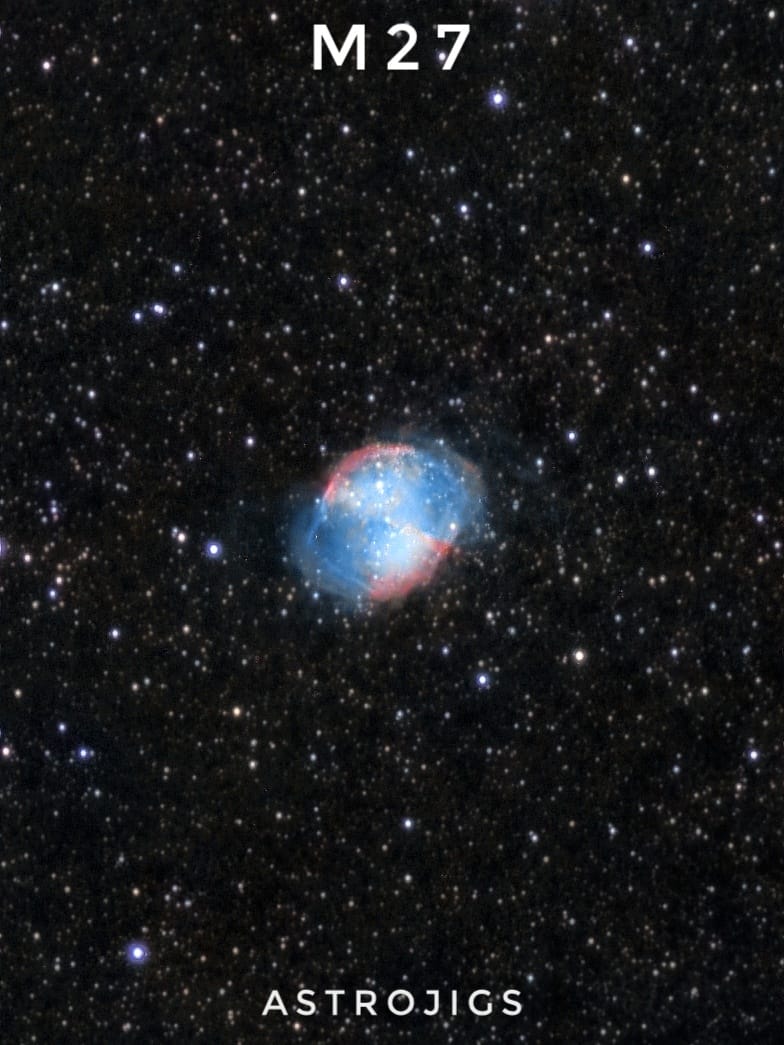
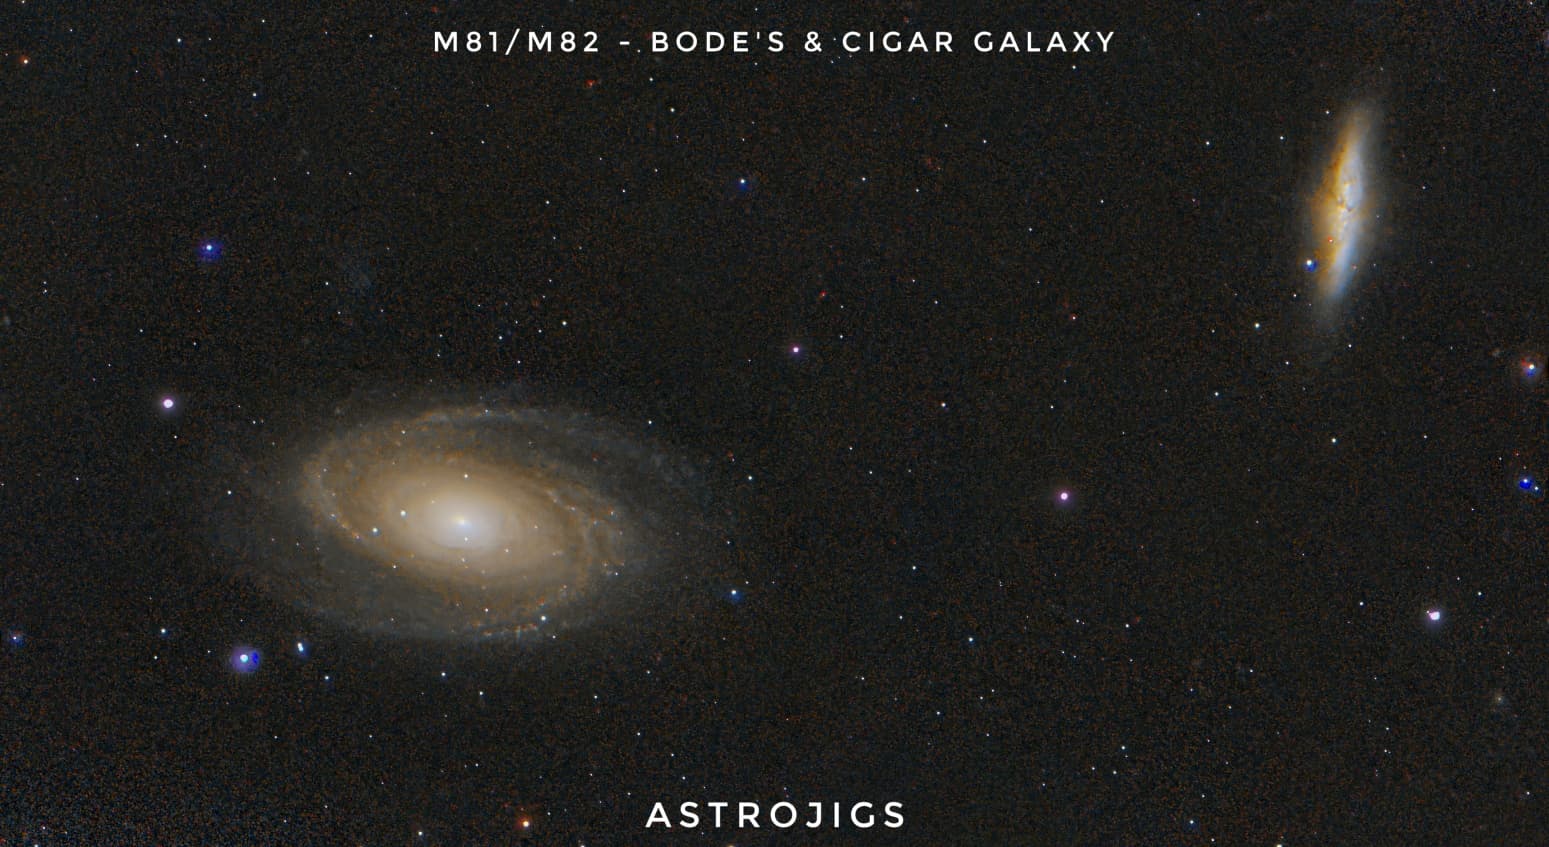
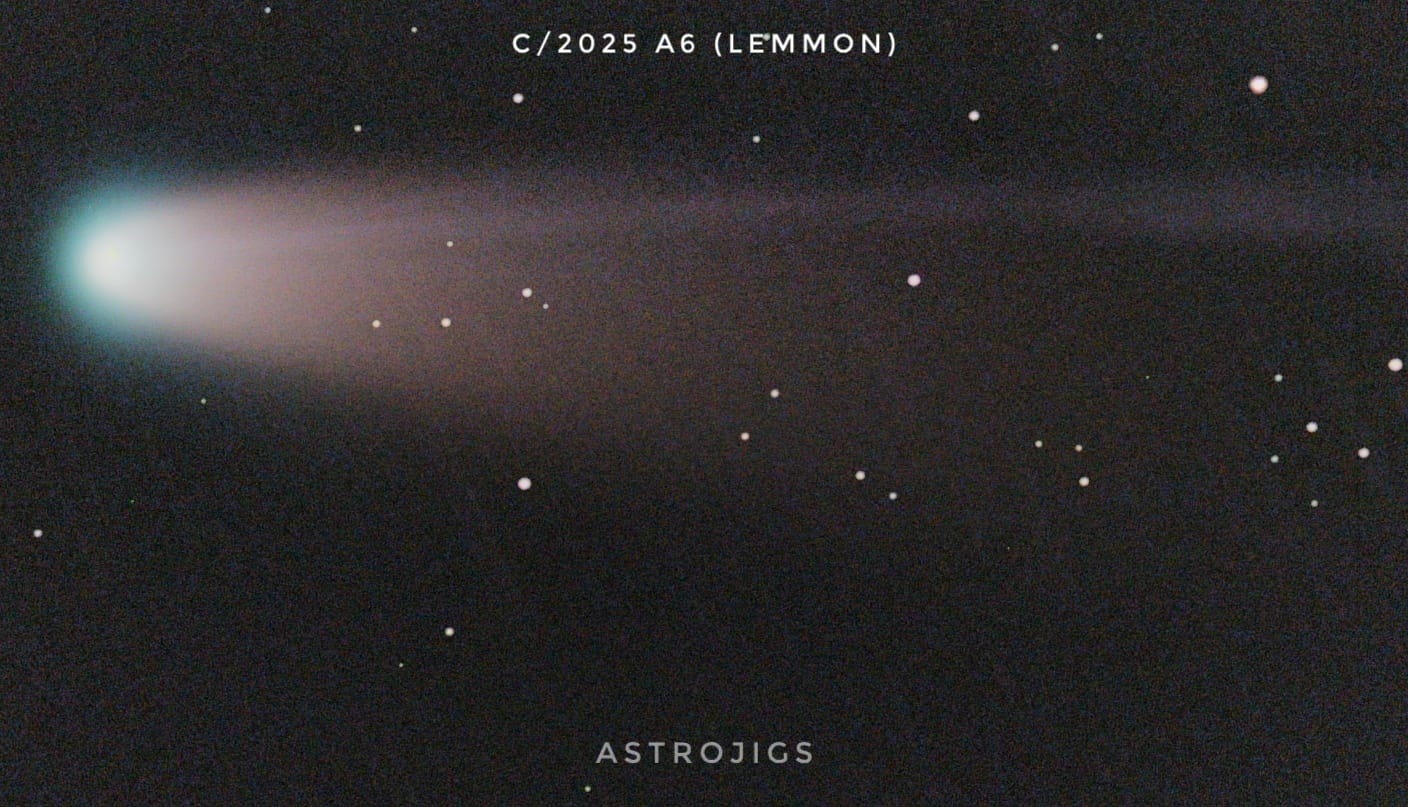
- 03 Photographing . Narrow-band emission nebulae from Dublin's backyard skies.